The exhibition ended on June 10, 2011. The information of the graphs below is only a representation.
MAP SMILES:
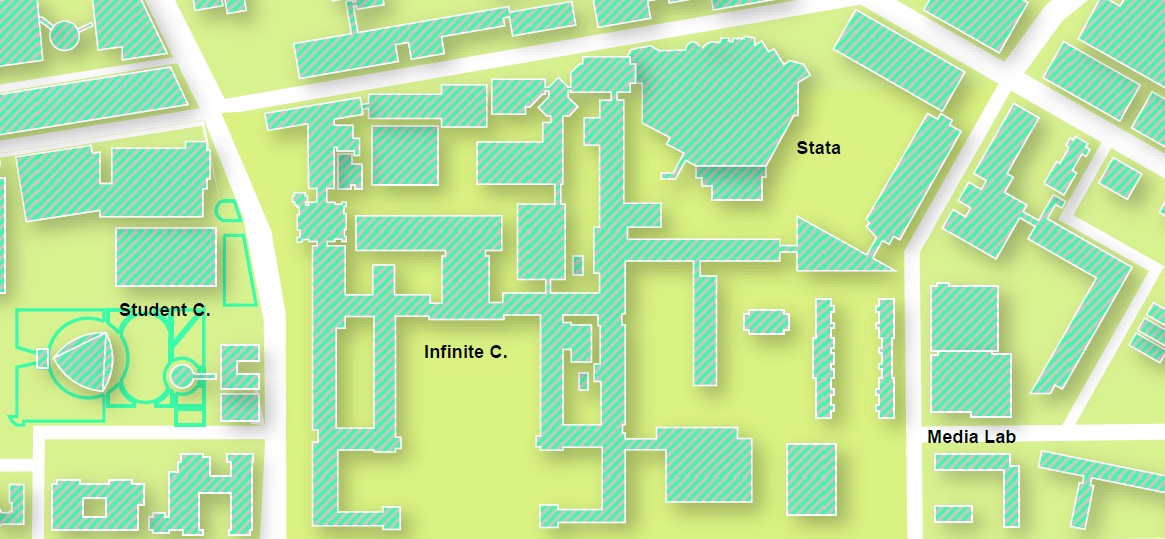
The following map shows a real time heat map of MIT campus in terms of smiles. Feel free to explore the 3D version of this map (may require to install Google Earth plugin).

|
| Show Google Earth |
METERS:
These meters show the intensity of smiles at four locations of MIT. The bottom and left bars show a comparison and aggregate of the locations respectively.
|
|